


Page 432 - TBE_Book_V2_2019
P. 432
Chapter 12c


             Global distribution of the


                                           TBEV


              Gerhard Dobler, Wilhelm Erber and Heinz-Josef Schmitt

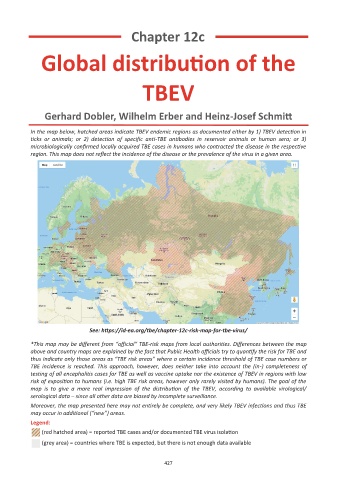
          In the map below, hatched areas indicate TBEV endemic regions as documented either by 1) TBEV detection in
          ticks  or  animals;  or  2)  detection  of  specific  anti-TBE  antibodies  in  reservoir  animals  or  human  sera;  or  3)
          microbiologically confirmed locally acquired TBE cases in humans who contracted the disease in the respective
          region. This map does not reflect the incidence of the disease or the prevalence of the virus in a given area.


                           See: https://id-ea.org/tbe/chapter-12c-risk-map-for-tbe-virus/

          *This map may be different from “official” TBE-risk maps from local authorities. Differences between the map
          above and country maps are explained by the fact that Public Health officials try to quantify the risk for TBE and
          thus indicate only those areas as “TBE risk areas” where a certain incidence threshold of TBE case numbers or
          TBE  incidence  is  reached.  This  approach,  however, does  neither  take  into  account  the  (in-)  completeness  of
          testing of all encephalitis cases for TBE as well as vaccine uptake nor the existence of TBEV in regions with low
          risk of exposition to humans (i.e. high TBE risk areas, however only rarely visited by humans). The goal of the
          map  is  to  give  a  more  real  impression  of  the  distribution  of  the  TBEV,  according  to  available  virological/
          serological data – since all other data are biased by incomplete surveillance.
          Moreover, the map presented here may not entirely be complete, and very likely TBEV infections and thus TBE
          may occur in additional (“new”) areas.
          Legend:
             (red hatched area) = reported TBE cases and/or documented TBE virus isolation

             (grey area) = countries where TBE is expected, but there is not enough data available


                                                  434
                                                  427

