


Page 242 - TBE_Book_V2_2019
P. 242
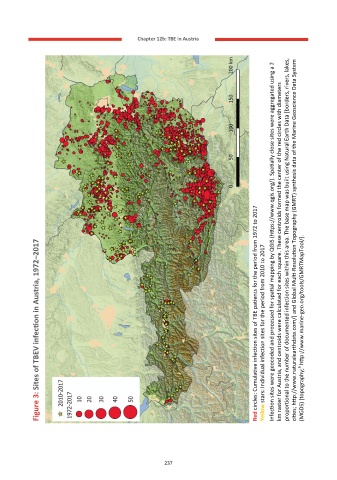
Chapter 12b: TBE in Austria             Infection sites were geocoded and processed for spatial mapping by QGIS (https://www.qgis.org/). Spatially close sites were aggregated using a 2  proportional to the number of documented infection sites within this area. The base map was built using Natural Earth Data [borders, rivers, lakes,  cities; http://www.


            Figure 3: Sites of TBEV infection in Austria, 1972–2017


                                                  237                        Red circles: Cumulative infection sites of TBE patients for the period from 1972 to 2017  Yellow stars: Individual infection sites for the period from 2010 to 2017  km raster for Austria, and centroids were calculated for each square. These centroids formed the center of the red circles with diameters  (MGDS) [topogra

