


Page 289 - TBE_Book_V2_2019
P. 289
Chapter 12b: TBE in Finland


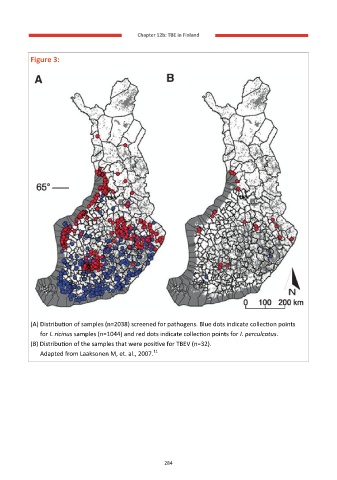
            Figure 3:


          (A) Distribution of samples (n=2038) screened for pathogens. Blue dots indicate collection points
             for I. ricinus samples (n=1044) and red dots indicate collection points for I. perculcatus.
          (B) Distribution of the samples that were positive for TBEV (n=32).
                                              11
             Adapted from Laaksonen M, et. al., 2007.


                                                  284

