


Page 235 - TBE_Book_V2_2019
P. 235
Chapter 12a: Epidemiology by country – overview


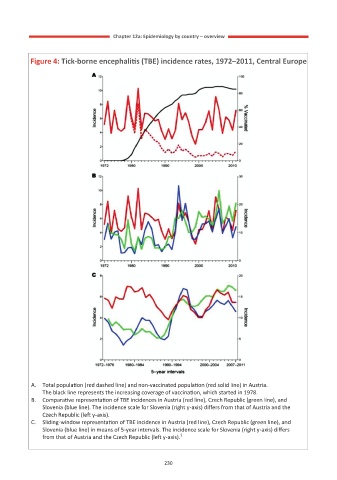
          Figure 4: Tick-borne encephalitis (TBE) incidence rates, 1972–2011, Central Europe


          A.  Total population (red dashed line) and non-vaccinated population (red solid line) in Austria.
              The black line represents the increasing coverage of vaccination, which started in 1978.
          B.  Comparative representation of TBE incidences in Austria (red line), Czech Republic (green line), and
              Slovenia (blue line). The incidence scale for Slovenia (right y-axis) differs from that of Austria and the
              Czech Republic (left y-axis).
          C.  Sliding-window representation of TBE incidence in Austria (red line), Czech Republic (green line), and
              Slovenia (blue line) in means of 5-year intervals. The incidence scale for Slovenia (right y-axis) differs
                                                      1
              from that of Austria and the Czech Republic (left y-axis).


                                                  230
                                                  230

